Utilization Trend Card
Utilization Trend Card
Utilization cards display the current utilization and a trend of a single metric. The most common use case for this pattern is seen in a dashboard.
Jump to Card with a Single Metric or Card with Multiple Metrics
Card with a Single Metric
Card with Multiple Metrics
Utilization Trend Card
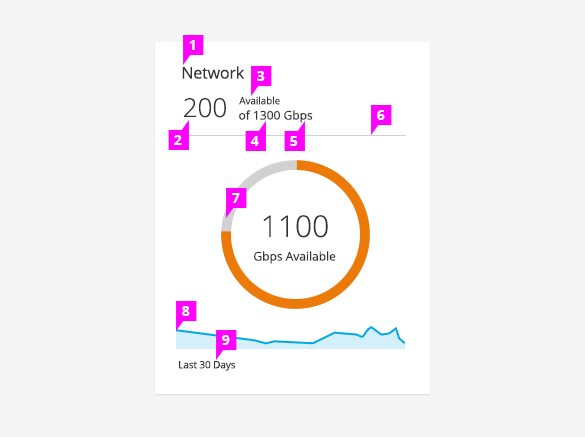
Card with a Single Metric
-
Metric Title: Display the metric name.
-
Current Value: Display the current value. This could be available, which is the PatternFly default, or used.
-
Label: The label for the value is left aligned and listed above the total value.
-
Total Value: The total value is left aligned and listed under the label.
-
Unit of Measurement: The label for unit of measurement is shown after the total value.
-
Content Separator: A horizontal line visually separates the content in the card. The content separator is located below the values and above the donut chart.
-
Donut Chart: See the Donut Chart Pattern for more details.
-
Sparkline: See the Sparkline Pattern for more details.
-
Time Frame (optional): The time frame is indicated under the sparkline by small text and is left aligned.
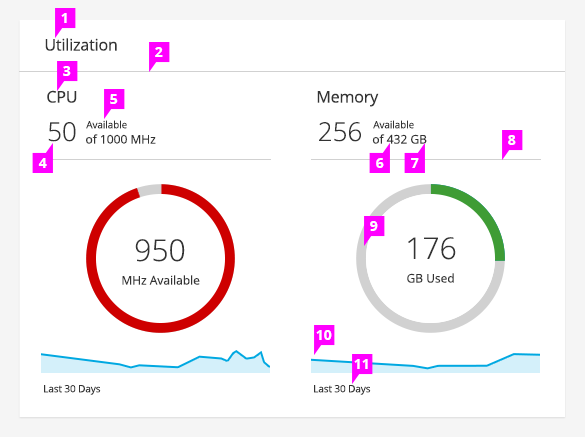
Card with Multiple Metrics
-
Card Title: Use a card title if multiple metrics are shown in one card.
-
Title Separator: Include a horizontal line under the card title.
-
Metric Title: Display the metric name.
-
Current Value: Display the current value. This could be the amount available (PatternFly default) or the amount used.
-
Label: The label for the value is left aligned and listed above the total value.
-
Total Value: The total value is left aligned and listed under the label.
-
Unit of Measurement: The label for unit of measurement is shown after the total value.
-
Content Separator: A horizontal line visually separates the content in the card. The content separator is located below the values and above the donut chart.
-
Donut Chart: See the Donut Chart Pattern for more details.
-
Sparkline: See the Sparkline Pattern for more details.
-
Time Frame (optional): The time frame is indicated under the sparkline by small text and is left aligned.
- View Angular PatternFly Example
- View PatternFly NG Example
- View PatternFly React Example
PatternFly Core Example
Jump to Card with a Single Metric or Card with Multiple Metrics
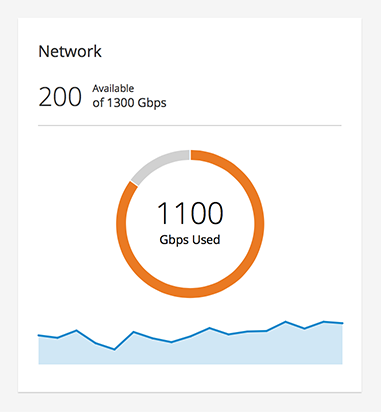
Card with a Single Metric
Network
200 Available of 1300 Gbps
    <script src="components/c3/c3.min.js"></script>
    <script src="components/d3/d3.min.js"></script>
    <body class="cards-pf">
      ...
      <div class="container-fluid container-cards-pf">
        <div class="row row-cards-pf">
          <div class="col-xs-6 col-sm-4 col-md-4">
            <div class="card-pf card-pf-utilization">
  <h2 class="card-pf-title">
    Network
  </h2>
  <div class="card-pf-body">
    <p class="card-pf-utilization-details">
      <span class="card-pf-utilization-card-details-count">200</span>
        <span class="card-pf-utilization-card-details-description">
          <span class="card-pf-utilization-card-details-line-1">Available</span>
          <span class="card-pf-utilization-card-details-line-2">of 1300 Gbps</span>
        </span>
    </p>
    <div id="chart-pf-donut-5"></div>
    <div class="chart-pf-sparkline" id=""></div>
    <script>
      var c3ChartDefaults = $().c3ChartDefaults();

      var donutConfig = c3ChartDefaults.getDefaultDonutConfig('A');
      donutConfig.bindto = '#chart-pf-donut-5';
      donutConfig.color =  {
        pattern: ["#EC7A08","#D1D1D1"]
      };
      donutConfig.data = {
        type: "donut",
        columns: [
          ["Used", 85],
          ["Available", 15]
        ],
        groups: [
          ["used", "available"]
        ],
        order: null
      };
      donutConfig.tooltip = {
        contents: function (d) {
          return '<span class="donut-tooltip-pf" style="white-space: nowrap;">' +
                  Math.round(d[0].ratio * 100) + '%' + ' Gbps ' + d[0].name +
                  '</span>';
        }
      };

      var chart1 = c3.generate(donutConfig);
      var donutChartTitle = d3.select("#chart-pf-donut-5").select('text.c3-chart-arcs-title');
      donutChartTitle.text("");
      donutChartTitle.insert('tspan').text("1100").classed('donut-title-big-pf', true).attr('y', 0).attr('x', 0);
      donutChartTitle.insert('tspan').text("Gbps Used").classed('donut-title-small-pf', true).attr('y', 20).attr('x', 0);

      var sparklineConfig = c3ChartDefaults.getDefaultSparklineConfig();
      sparklineConfig.bindto = '#';
      sparklineConfig.data = {
        columns: [
          ['%', 60, 55, 70, 44, 31, 67, 54, 46, 58, 75, 62, 68, 69, 88, 74, 88, 85],
        ],
        type: 'area'
      };

      var chart2 = c3.generate(sparklineConfig);
    </script>
  </div>
</div>

          </div>
        </div><!-- /row -->
      </div><!-- /container -->
    </body>
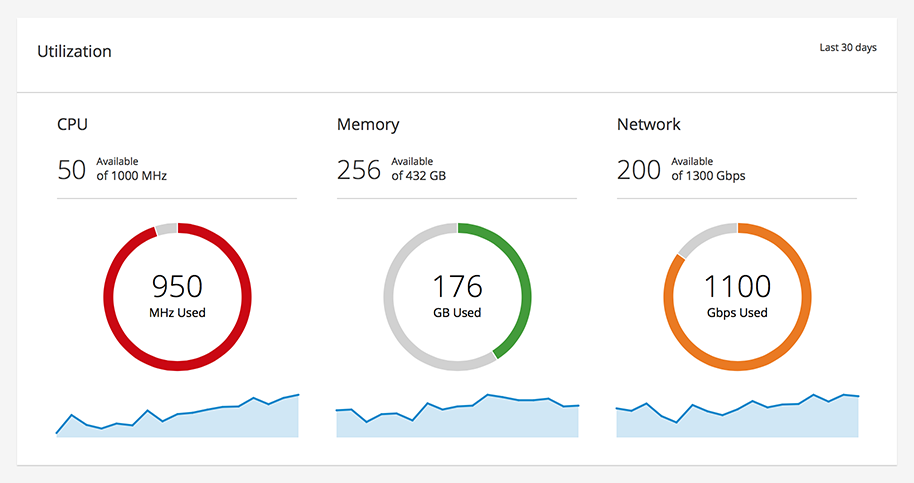
Card with Multiple Metrics
Last 30 days
Utilization
CPU
50 Available of 1000 MHz
Memory
256 Available of 432 GB
Network
200 Available of 1300 Gbps
    <script src="components/c3/c3.min.js"></script>
    <script src="components/d3/d3.min.js"></script>

    <body class="cards-pf">
      ...
      <div class="container-fluid container-cards-pf">
        <div class="row row-cards-pf">
          <div class="col-xs-12">
            <div class="card-pf card-pf-utilization">
  <div class="card-pf-heading">
    <p class="card-pf-heading-details">Last 30 days</p>
    <h2 class="card-pf-title">
      Utilization
    </h2>
  </div>
  <div class="card-pf-body">
    <div class="row">
      <div class="col-xs-12 col-sm-4 col-md-4">
        <h3 class="card-pf-subtitle">CPU</h3>
        <p class="card-pf-utilization-details">
          <span class="card-pf-utilization-card-details-count">50</span>
            <span class="card-pf-utilization-card-details-description">
              <span class="card-pf-utilization-card-details-line-1">Available</span>
              <span class="card-pf-utilization-card-details-line-2">of 1000 MHz</span>
            </span>
        </p>
        <div id="chart-pf-donut-6"></div>
        <div class="chart-pf-sparkline" id="chart-pf-sparkline-6"></div>
        <script>
          var donutConfig = $().c3ChartDefaults().getDefaultDonutConfig('A');
          donutConfig.bindto = '#chart-pf-donut-6';
          donutConfig.color =  {
            pattern: ["#cc0000","#D1D1D1"]
          };
          donutConfig.data = {
            type: "donut",
            columns: [
              ["Used", 95],
              ["Available", 5]
            ],
            groups: [
              ["used", "available"]
            ],
            order: null
          };
          donutConfig.tooltip = {
            contents: function (d) {
              return '<span class="donut-tooltip-pf" style="white-space: nowrap;">' +
                      Math.round(d[0].ratio * 100) + '%' + ' MHz ' + d[0].name +
                      '</span>';
            }
          };

          var chart1 = c3.generate(donutConfig);
          var donutChartTitle = d3.select("#chart-pf-donut-6").select('text.c3-chart-arcs-title');
          donutChartTitle.text("");
          donutChartTitle.insert('tspan').text("950").classed('donut-title-big-pf', true).attr('y', 0).attr('x', 0);
          donutChartTitle.insert('tspan').text("MHz Used").classed('donut-title-small-pf', true).attr('y', 20).attr('x', 0);

          var sparklineConfig = $().c3ChartDefaults().getDefaultSparklineConfig();
          sparklineConfig.bindto = '#chart-pf-sparkline-6';
          sparklineConfig.data = {
            columns: [
              ['%', 10, 50, 28, 20, 31, 27, 60, 36, 52, 55, 62, 68, 69, 88, 74, 88, 95],
            ],
            type: 'area'
          };
          var chart2 = c3.generate(sparklineConfig);
        </script>
      </div>
      <div class="col-xs-12 col-sm-4 col-md-4">
        <h3 class="card-pf-subtitle">Memory</h3>
        <p class="card-pf-utilization-details">
          <span class="card-pf-utilization-card-details-count">256</span>
            <span class="card-pf-utilization-card-details-description">
              <span class="card-pf-utilization-card-details-line-1">Available</span>
              <span class="card-pf-utilization-card-details-line-2">of 432 GB</span>
            </span>
        </p>
        <div id="chart-pf-donut-7"></div>
        <div class="chart-pf-sparkline" id="chart-pf-sparkline-7"></div>
        <script>
          var donutConfig = $().c3ChartDefaults().getDefaultDonutConfig('A');
          donutConfig.bindto = '#chart-pf-donut-7';
          donutConfig.color =  {
            pattern: ["#3f9c35","#D1D1D1"]
          };
          donutConfig.data = {
            type: "donut",
            columns: [
              ["Used", 41],
              ["Available", 59]
            ],
            groups: [
              ["used", "available"]
            ],
            order: null
          };
          donutConfig.tooltip = {
            contents: function (d) {
              return '<span class="donut-tooltip-pf" style="white-space: nowrap;">' +
                      Math.round(d[0].ratio * 100) + '%' + ' GB ' + d[0].name +
                      '</span>';
            }
          };

          var chart3 = c3.generate(donutConfig);
          var donutChartTitle = d3.select("#chart-pf-donut-7").select('text.c3-chart-arcs-title');
          donutChartTitle.text("");
          donutChartTitle.insert('tspan').text("176").classed('donut-title-big-pf', true).attr('y', 0).attr('x', 0);
          donutChartTitle.insert('tspan').text("GB Used").classed('donut-title-small-pf', true).attr('y', 20).attr('x', 0);

          var sparklineConfig = $().c3ChartDefaults().getDefaultSparklineConfig();
          sparklineConfig.bindto = '#chart-pf-sparkline-7';
          sparklineConfig.data = {
            columns: [
              ['%', 35, 36, 20, 30, 31, 22, 44, 36, 40, 41, 55, 52, 48, 48, 50, 40, 41],
            ],
            type: 'area'
          };
          var chart4 = c3.generate(sparklineConfig);
        </script>
      </div>
      <div class="col-xs-12 col-sm-4 col-md-4">
        <h3 class="card-pf-subtitle">Network</h3>
        <p class="card-pf-utilization-details">
          <span class="card-pf-utilization-card-details-count">200</span>
            <span class="card-pf-utilization-card-details-description">
              <span class="card-pf-utilization-card-details-line-1">Available</span>
              <span class="card-pf-utilization-card-details-line-2">of 1300 Gbps</span>
            </span>
        </p>
        <div id="chart-pf-donut-8"></div>
        <div class="chart-pf-sparkline" id="chart-pf-sparkline-8"></div>
        <script>
          var donutConfig = $().c3ChartDefaults().getDefaultDonutConfig('A');
          donutConfig.bindto = '#chart-pf-donut-8';
          donutConfig.color =  {
            pattern: ["#EC7A08","#D1D1D1"]
          };
          donutConfig.data = {
            type: "donut",
            columns: [
              ["Used", 85],
              ["Available", 15]
            ],
            groups: [
              ["used", "available"]
            ],
            order: null
          };
          donutConfig.tooltip = {
            contents: function (d) {
              return '<span class="donut-tooltip-pf" style="white-space: nowrap;">' +
                      Math.round(d[0].ratio * 100) + '%' + ' Gbps ' + d[0].name +
                      '</span>';
            }
          };

          var chart5 = c3.generate(donutConfig);
          var donutChartTitle = d3.select("#chart-pf-donut-8").select('text.c3-chart-arcs-title');
          donutChartTitle.text("");
          donutChartTitle.insert('tspan').text("1100").classed('donut-title-big-pf', true).attr('y', 0).attr('x', 0);
          donutChartTitle.insert('tspan').text("Gbps Used").classed('donut-title-small-pf', true).attr('y', 20).attr('x', 0);

          var sparklineConfig = $().c3ChartDefaults().getDefaultSparklineConfig();
          sparklineConfig.bindto = '#chart-pf-sparkline-8';
          sparklineConfig.data = {
            columns: [
              ['%', 60, 55, 70, 44, 31, 67, 54, 46, 58, 75, 62, 68, 69, 88, 74, 88, 85],
            ],
            type: 'area'
          };
          var chart6 = c3.generate(sparklineConfig);
        </script>
      </div>
    </div>
  </div>
</div>

          </div>
        </div><!-- /row -->
      </div><!-- /container -->
    </body>