Area Chart
Area Chart
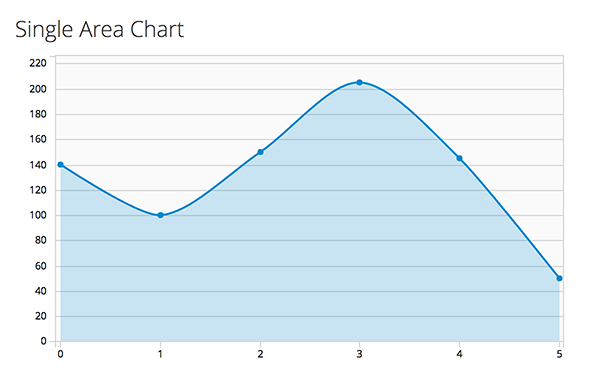
A Single Area Chart is used to provide metrics for a single data point. While similar to a line chart in both form and function, it offers an area fill for visual emphasis. The area fill below the line also functions to indicate cumulative data.
- The most common use case for area charts is to show trending over a continuous scale (usually time.)
- Use this instead of a line chart when you need to provide more visual emphasis than a simple line chart would offer. See the Line Chart pattern for more information about line charts.
Area Chart
-
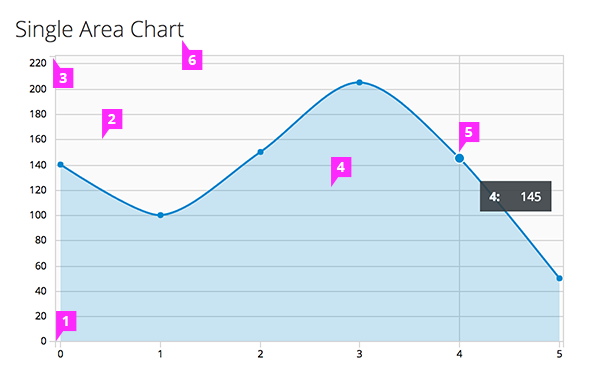
Axis Lines: - The “x” axis is commonly used for time values, and the “y” axis is used for metric values. - Use consistent spacing for the axis line intervals and tick marks. - Tick marks are optional.
-
Grid Lines: - Horizontal grid lines (recommended): The lines help users associate a point in the chart with a value on the axis. - Vertical Grid lines (optional): While helpful, in some contexts they might create visual noise.
-
Data Line: - A solid line is used at the top of the area chart to show a total value. - Use straight lines (linear interpolation), if it’s important to display more precise data values.
-
Data Area Fill: - The area fill is presented below the data line. - Data area fills use colors that conform with the PatternFly color palette.
-
Interactive Data Points: - Specific data points may be represented by dots on the line portion of the area chart. - To help the user see which point they are hovering, the dot expands and a vertical line is displayed. In addition, a tooltip should appear with the associated values for that specific point in time.
-
Chart Title: Provide a title that describes the chart.
-
Legend (optional): Provide a legend that associates the individual data point with a color mapping. It may be used to provide more detailed information in support of the chart title. Position the legend below, or to the right of the chart.
- View Angular PatternFly Example
- View PatternFly NG Example
- View PatternFly React Example
PatternFly Core Example
Single Area Chart
<script src="components/c3/c3.min.js"></script>
<script src="components/d3/d3.min.js"></script>
<div id="area-chart-4" class="line-chart-pf"></div>
<script>
  var areaChartDataColumns = [
    ['data1', 350, 400, 350, 0],
    ['data2', 140, 100, 150, 205, 145, 50],
    ['data3', 10, 60, 90, 10, 325, 400],
    ['data4', 260, 10, 305, 100, 50, 150]
  ];
  var singleAreaChartDataColumns = [
    ['data2', 140, 100, 150, 205, 145, 50]
  ];

  var c3ChartDefaults = $().c3ChartDefaults();
  var singleAreaChartConfig = c3ChartDefaults.getDefaultSingleAreaConfig();
  singleAreaChartConfig.bindto = '#area-chart-4';
  singleAreaChartConfig.data = {
    columns: singleAreaChartDataColumns,
    type: 'area-spline'
  };
  var singleAreaChart = c3.generate(singleAreaChartConfig);
</script>