Bullet Chart
Bullet Chart
The most common use case for the Bullet Graph, an alternate to meters and gauges, is the comparison of one featured measure to one or more related measures within qualitative ranges. The Bullet Graph features one primary measure (e.g., year-to-date revenue), and one or more comparative measures (e.g., a target number, last year’s revenue) displayed on a scale containing two to five qualitative ranges (e.g., poor, good, excellent).
Jump to Horizontal Chart, Vertical Chart or Alternative Variations
Horizontal Chart
Vertical Chart
Alternative Variations
Bullet Chart
Jump to Standard Bullet Chart, Segmented Primary Measure, Negative Primary Measure, Reversed Ranges, Scale Greater Than Zero, Measure Greater Than Max Range, Horizontal Group, or Vertical Group
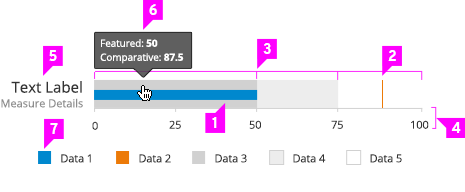
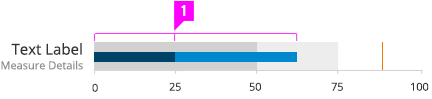
Standard Bullet Chart
-
Featured Measure Bar: Use a visually prominent fill color for the featured measure bar. See the color palette for color recommendations.
- Comparative Measure Line (optional):
- Display up to two comparative measures using thin lines perpendicular to the featured measure bar.
- The featured measure bar should appear below comparative measure lines in the case of an overlap.
- Qualitative Range Bars (optional):
- To show the qualitative state of primary and comparative measures, display two to five qualitative ranges (e.g., poor, good, excellent).
- The qualitative range fill colors should be visually less prominent than the featured and comparative measures. See the color palette for color recommendations.
-
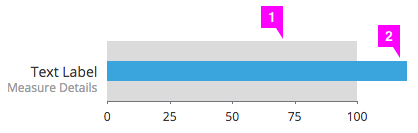
Quantitative Scale: Display a quantitative scale of equal intervals of measure along a single linear axis. Major tick marks should be displayed at each labeled interval. Minor tick marks can be displayed between major intervals if necessary.
- Text Label:
- The primary measure is labeled here.
- Text labels should be placed above vertically-oriented graphs and to the left of horizontally-oriented graphs. See the Variations sections for more examples.
-
Tooltip: Display featured and comparative measures in a hover tooltip.
- Legend (optional):
- Include a legend to define the featured measure, comparative measures, and qualitative ranges.
- Interactive Legend (optional): Clicking on a series in the legend should toggle the visibility of the series in the graph.
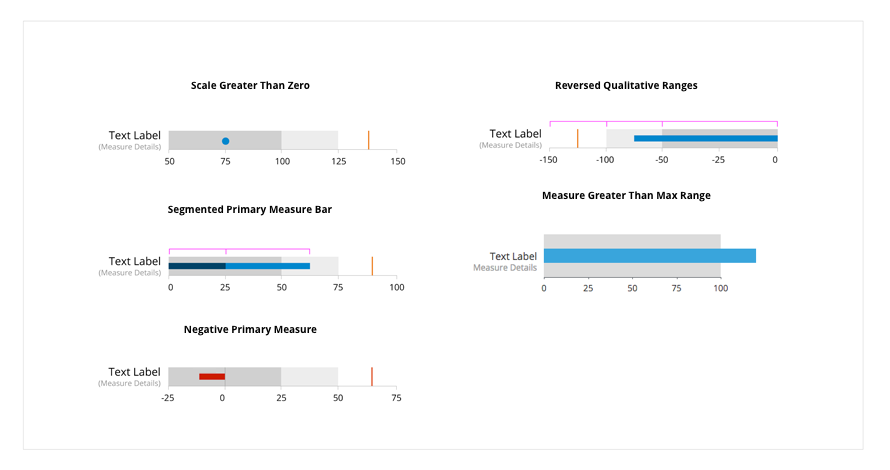
Variations
Segmented Primary Measure
- Segmented Primary Measure Bar: Display a segmented primary measure to call out actual and projected primary measures.
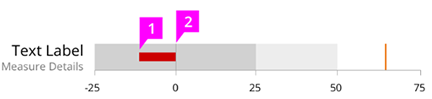
Negative Primary Measure
-
Negative Primary Measure: Use of a red fill color for the primary measure bar is recommended to emphasize values considered to be bad when they are low.
-
Zero Line: Display a vertical line at the zero mark on scales containing negative and positive values.
Reversed Ranges
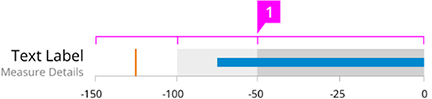
- Reversed Qualitative Ranges: Show reversed qualitative ranges for graphs containing measures considered to be good when they are low.
Scale Greater Than Zero
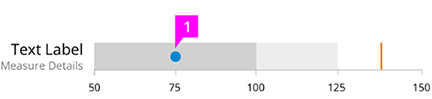
- Primary Measure Dot: Display the primary measure as a dot when the scale starts at a value greater than zero.
Measure Greater Than Max Range
-
Single Qualitative Range Bar: Display the range bar, which represents the min and max values.
-
Primary Measure Bar: Display the primary measure bar, which can optionally be segmented.
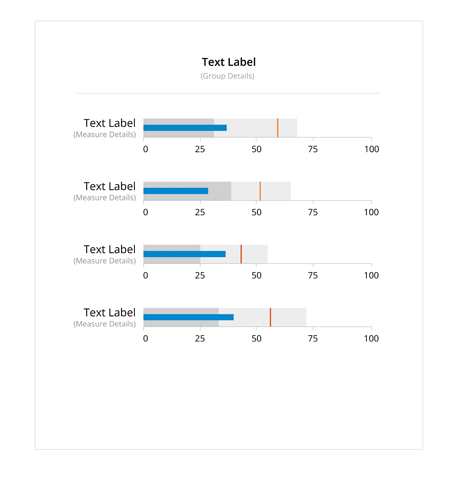
Horizontal Group
-
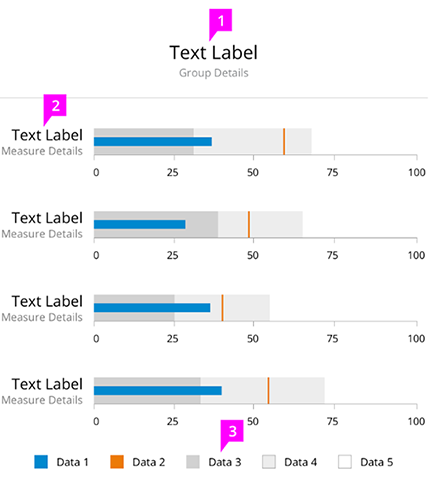
Group Label (optional): Include a center-aligned text label above horizontally-oriented graphs.
- Graph Label:
- Position right-aligned text labels to the left of horizontally-oriented graphs.
- Horizontal divider line (optional): Include a thin horizontal divider line between the group label and graphs below.
- Legend (optional):
- Include a legend to define the featured measure, comparative measures, and qualitative ranges.
- Interactive Legend (optional): Clicking on a series in the legend should toggle the visibility of the series in the graph.
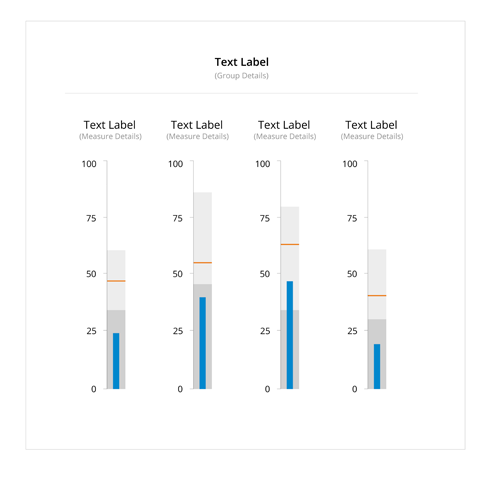
Vertical Group
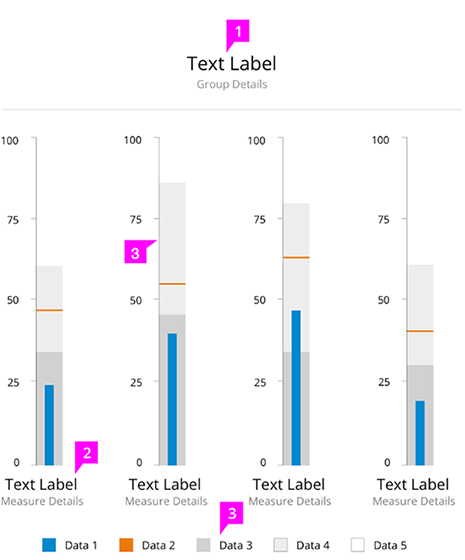
- Group Label (optional):
- Include a group label above vertical graph groups.
- Horizontal divider line (optional): Include a thin horizontal divider line between the group label and graphs below.
-
Graph Label: Include a graph label below vertically-oriented graphs.
-
Scale Position: Place the scale on the left or right of vertically-oriented graphs. Scale position should be the same for all graphs in a group.
- Legend (optional):
- Include a legend to define the featured measure, comparative measures, and qualitative ranges.
- Interactive Legend (optional): Clicking on a series in the legend should toggle the visibility of the series in the graph.
- View Angular PatternFly Example
- View PatternFly NG Example
- View PatternFly React Example
PatternFly Core Example Not Available
There is no PatternFly-Core code available for this pattern at this time. Links to the JS framework implementations can be seen above.
Visit the Contributing to PatternFly documentation to learn how to contribute the code.