Pie Chart
Pie Chart
Pie charts are commonly used to show percentages or proportional data. It makes sense to choose a pie chart when you need to compare a set of values to a whole. For example, you might choose a pie chart when visualizing the number of sales made by a team of five people; each segment of the chart represents one salesperson’s performance in the context of the rest of the team.
The sum of all of the segments of the chart must equal 100%, and the data points should be mutually exclusive. It is recommended that there are no more than six segments per single pie chart.
A pie chart may be the wrong choice when you need to compare categories to one another, because it can be difficult to distinguish small differences between segments. If you wish to compare values to each other, the Bar Chart pattern may be a more effective pattern.
Currently, PatternFly has not collected user research data on this pattern. If you’d like to contribute to this documentation, please see our Get Started guide for details.
Jump to Pie Chart with Bottom Legend, Pie Chart with Right Legend, Pie Chart with No Legend, or Small Pie Chart with Label
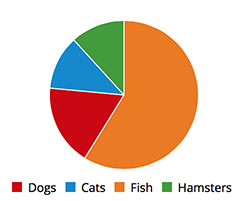
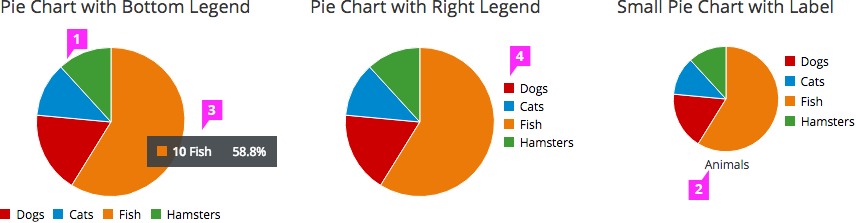
Pie Chart with Bottom Legend
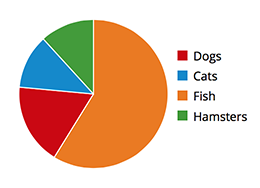
Pie Chart with Right Legend
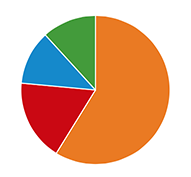
Pie Chart with No Legend
It would be appropriate to use a Pie Chart with no legend in situations where color makes a clear visual association to the data. However, you should consider the impact this will have on visually-impaired or colorblind users.
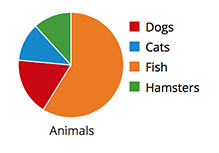
Small Pie Chart with Label
The small pie chart can be used to conserve space in appropriate situations, but avoid reducing the size of the chart to the point that the segments are difficult to compare.
Pie Chart
- Pie Chart Fill:
- Fill colors should be based on the PatternFly Color Palette.
- Interaction (optional):
- If drill-down behavior is supported, clicking on a segment of the chart will trigger an associated action or navigation.
- If supported, right clicking on a segment of the pie chart will bring up a menu with associated actions.
-
Label (optional): The label may be shown either on top or bottom of the pie chart.
-
Tooltip (optional): We recommend that the name and quantity/percentage are displayed on hover.
- Legend: It is recommended to include a legend to show values and define the colors on the chart. On the pie chart, the legend should be left-aligned. It should be placed beneath or to the right of the pie chart.
- Interaction (optional):
- Clicking on a series in the legend should toggle the visibility of the segment in the chart.
- Hovering over a series in the legend will highlight the segment of the chart associated with that attribute.
- View Angular PatternFly Example
- View PatternFly NG Example
- View PatternFly React Example
PatternFly Core Example
Jump to Pie Chart or Small Pie Chart
Pie Chart
<script src="components/c3/c3.min.js"></script>
<script src="components/d3/d3.min.js"></script>
<div id="pie-chart-5" class="example-pie-chart"></div>
<div id="pie-chart-6" class="example-pie-chart-right-legend"></div>
<div id="pie-chart-7" class="example-pie-chart-bottom-legend"></div>
<script>
  var c3ChartDefaults = $().c3ChartDefaults();

  var pieData = {
    type : 'pie',
    colors: {
      Dogs: $.pfPaletteColors.red,
      Cats: $.pfPaletteColors.blue,
      Fish: $.pfPaletteColors.orange,
      Hamsters: $.pfPaletteColors.green
    },
    columns: [
      ['Dogs', 3],
      ['Cats', 2],
      ['Fish', 10],
      ['Hamsters', 2]
    ],
    onclick: function (d, i) { console.log("onclick", d, i); },
    onmouseover: function (d, i) { console.log("onmouseover", d, i); },
    onmouseout: function (d, i) { console.log("onmouseout", d, i); }
  };

  // Pie Chart without Legend
  var pieChartConfig = c3ChartDefaults.getDefaultPieConfig();
  pieChartConfig.bindto = '#pie-chart-5';
  pieChartConfig.data = pieData;
  pieChartConfig.size = {
    width: 200,
    height: 171
  };
  var pieChartNoLegend = c3.generate(pieChartConfig);

  // Right Legend
  var pieChartRightConfig = c3ChartDefaults.getDefaultPieConfig();
  pieChartRightConfig.bindto = '#pie-chart-6';
  pieChartRightConfig.data = pieData;
  pieChartRightConfig.legend = {
    show: true,
    position: 'right'
  };
  pieChartRightConfig.size = {
    width: 251,
    height: 161
  };
  var pieChartRightLegend = c3.generate(pieChartRightConfig);

  // Pie Chart Bottom Legend
  var pieChartBottomConfig = c3ChartDefaults.getDefaultPieConfig();
  pieChartBottomConfig.bindto = '#pie-chart-7';
  pieChartBottomConfig.data = pieData;
  pieChartBottomConfig.legend = {
    show: true,
    position: 'bottom'
  };
  pieChartBottomConfig.size = {
    width: 321,
    height: 191
  };
  var pieChartBottomLegend = c3.generate(pieChartBottomConfig);
</script>
Small Pie Chart
<script src="components/c3/c3.min.js"></script>
<script src="components/d3/d3.min.js"></script>
<div id="pie-chart-8" class="pie-chart-pf example-pie-chart-mini"></div>
<div style="text-align: center; width: 220px;">Animals</div>
<script>
  var pieData = {
    type : 'pie',
    colors: {
      Dogs: $.pfPaletteColors.red,
      Cats: $.pfPaletteColors.blue,
      Fish: $.pfPaletteColors.orange,
      Hamsters: $.pfPaletteColors.green
    },
    columns: [
      ['Dogs', 3],
      ['Cats', 2],
      ['Fish', 10],
      ['Hamsters', 2]
    ],
    onclick: function (d, i) { console.log("onclick", d, i); },
    onmouseover: function (d, i) { console.log("onmouseover", d, i); },
    onmouseout: function (d, i) { console.log("onmouseout", d, i); }
  };

  var c3ChartDefaults = $().c3ChartDefaults();
  var pieChartSmallConfig = c3ChartDefaults.getDefaultPieConfig();
  pieChartSmallConfig.bindto = '#pie-chart-8';
  pieChartSmallConfig.data = pieData;
  pieChartSmallConfig.legend = {
    show: true,
    position: 'right'
  };
  pieChartSmallConfig.size = {
    width: 260,
    height: 115
  };

  var pieChartSmall = c3.generate(pieChartSmallConfig);
</script>