Sparkline
Sparkline
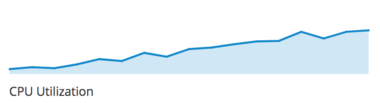
A sparkline is a small chart that helps users to analyze data and understand trends and patterns (e.g. CPU Utilization in an environment). Sparklines are commonly used in tables, reports, and dashboards.
Sparkline
-
Sparkline: The sparkline is blue with a light blue fill, which helps to visually define the x axis.
-
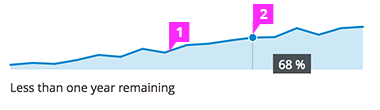
Tooltip: Use a tooltip on hover to display additional information about exact points on the sparkline such as values or percentages. A vertical line and dot may be added to accentuate the user’s hover point.
- View Angular PatternFly Example
- View PatternFly NG Example
- View PatternFly React Example
PatternFly Core Example
Example
Less than one year remaining
<script src="components/c3/c3.min.js"></script>
<script src="components/d3/d3.min.js"></script>
<div id="sparkline-chart-2" class="chart-pf-sparkline"></div>
<div>Less than one year remaining</div>
<script>
  var c3ChartDefaults = $().c3ChartDefaults();
  var sparklineChartConfig = c3ChartDefaults.getDefaultSparklineConfig();
  sparklineChartConfig.bindto = '#sparkline-chart-2';
  sparklineChartConfig.data = {
    columns: [
      ['%', 10, 14, 12, 20, 31, 27, 44, 36, 52, 55, 62, 68, 69, 88, 74, 88, 91],
    ],
    type: 'area'
  };
  var sparklineChart = c3.generate(sparklineChartConfig);
</script>